Over the last century and a half, famine events resulted in approximately 140 million deaths worldwide, a catastrophic toll due to systemic failures, conflicts, and policy decisions. This analysis summarizes some key trends in the frequency and mortality of famines between 1870 and 2022, focusing on events where estimated deaths exceeded 100,000, which qualifies them as “great famines” according to the Howe-Devereux scale.
Examining four metrics derived from the World Peace Foundation’s famine database and Our World in Data, we can draw some insights regarding famine frequency, scale (total loss of life), and intensity (deaths per 100,000). We must be aware that all figures are approximate, but they still offer valuable perspectives.
Frequency of New Famine Events and Active Famine Years
The frequency of new famine outbreaks has persisted remarkably over the past 150 years. From 1870 through the mid-20th century, the world experienced approximately five new famine episodes each decade—averaging one every two years. This rate decreased after 1950, dropping to about four new crises per decade. Even in recent years, despite advances in agriculture, global aid, and early warning and response, famines are recurring—and perhaps becoming more frequent.
Figure 1: Number of New Famines

Analyzing “famine years”—years in which at least one great famine was ongoing—provides another insight into the historical burden of famine. This includes instances where individual famine events spanned multiple years, such as the four-year famine in Poland from 1914 to 1918. As figure 2 illustrates, since 1870, active great famines have occurred globally in almost every half decade. While this global rate has remained broadly stable, the geographic distribution of famine has shifted notably. From 1870 to 1950, Asia experienced a great famine in roughly 60 percent of years, primarily in countries such as India, China, and Russia/USSR. Post-1950, that number fell significantly to approximately 35 percent—with recent famines concentrated in the Middle East. After a concentrated period of great famines in Europe during the World Wars, no famine event has been recorded in Europe post 1950. Conversely, Africa has moved in the opposite direction, with active great famines occurring during one-third of the years between 1870 and 1950, increasing to nearly two-thirds between 1950 and 2025.
Figure 2: Active Famine Years (semi-decades 1870-2025)

Mortality: Magnitude
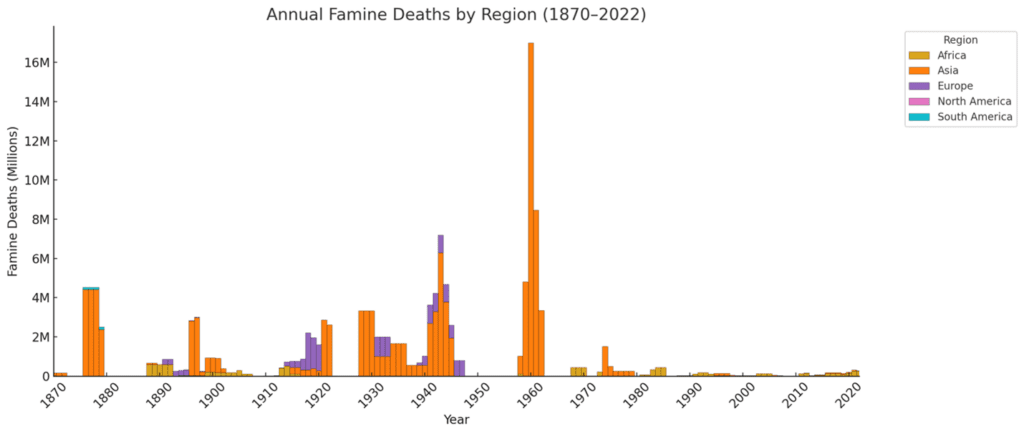
Globally, while the frequency of famine events has remained fairly stable, the human toll of famine has decreased significantly. Between 1870 and 1970, an estimated 130 million deaths occurred. Figure 3 shows where and when these deaths occurred.
Most were in Asia and Europe, and after the terrible and spectacular peak of deaths in the 1958-61 Great Leap Forward famine in China, the death toll has hugely subsided. After that date, the epicenter of famines has shifted to sub-Saharan Africa.
Figure 3: Annual Famine Deaths by Region 1870-2022

Mortality: Intensity.
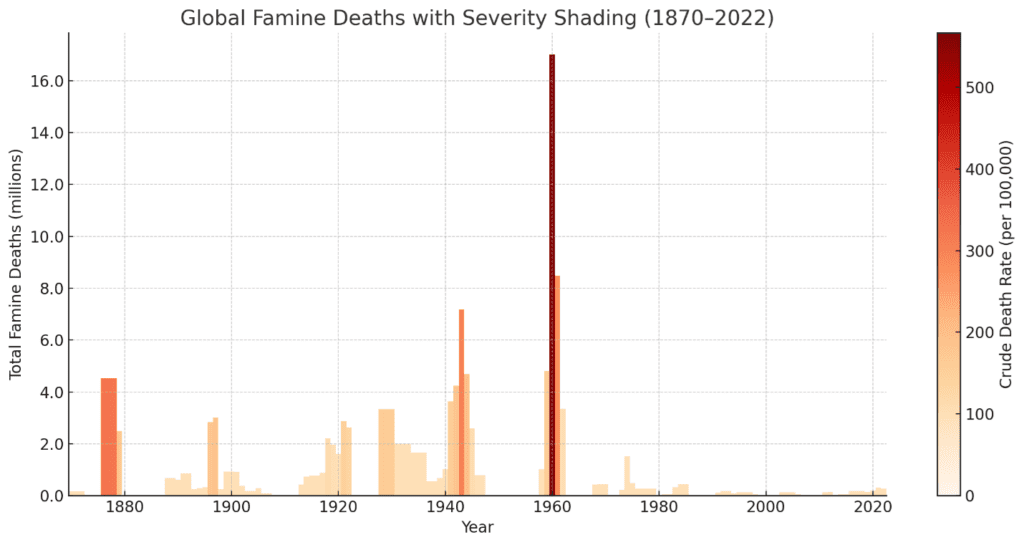
Late 19th and early 20th century famines were intense: they often killed more than 100 people per 100,000 in a national population (Figure 4). The Great Leap Forward famine was a uniquely devastating event, notable in both the magnitude of lives lost and intensity, with approximately 30 million deaths between the spring of 1959 and the end of 1961, and peak mortality rates above 500 deaths per 100,000.
From 1970 to 2022, both the absolute and per-capita mortality sharply decreased, with fewer than 9 million famine-related deaths recorded globally, representing only 6 percent of the pre-1970 total. Peak intensities rarely exceeded 50 deaths per 100,000.
Figure 4: Deaths per 100,000 in Famine Areas 1870 – 2022

Famines in the Contemporary Era
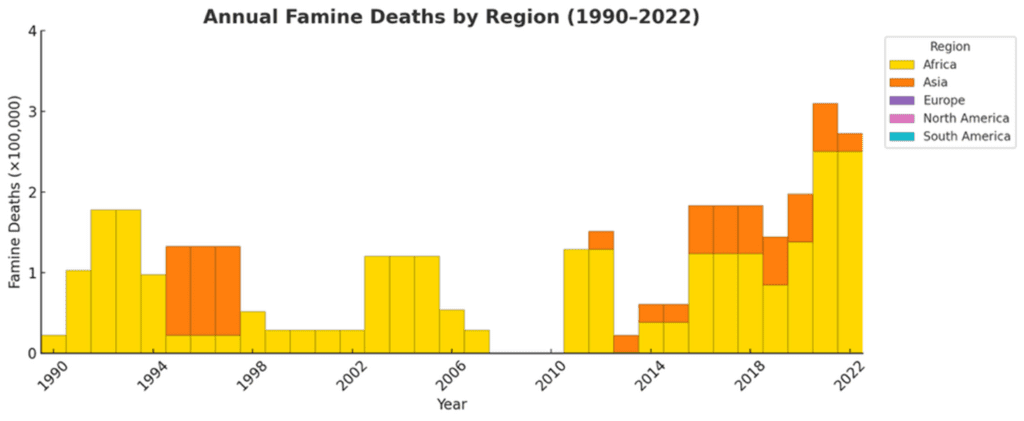
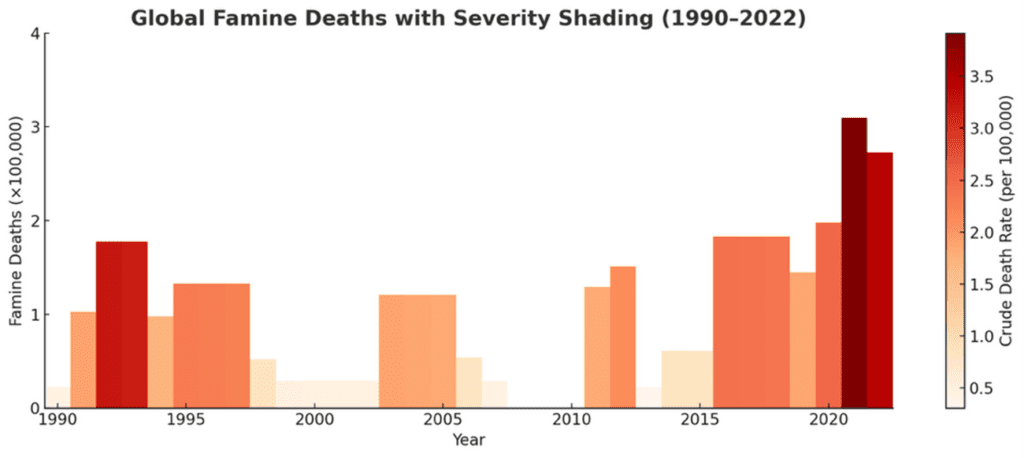
Since 1990, famines have been smaller in magnitude and intensity. Overall mortality was approximately 3–5 million deaths, with intensities dropping dramatically to about 1-4 deaths per 100,000, concentrated mostly in Africa. In the early 2000s, talk of eliminating famine forever was justified by the trends.
However, recent years show a worrying resurgence. Figure 5 and 6 illustrates how total mortality in just the last five years is as high as the combined mortality for 1990-2000, highlighting a concerning trend of famine’s reemergence after a brief window of reprise in the early 2000s. Recent severe crises, including Somalia’s 2011 famine (260,000 deaths) and the ongoing famine in Sudan and famine risk in multiple other crises, are likely to further increase famine mortality in the second half of the 2020s.
Figure 5: Annual Famine Deaths by Region 1990 – 2022

Figure 6: Deaths per 100,000 in Famine Areas 1990 – 2022


