We don’t know how many people in Gaza have perished from starvation and related health crisis. Nine months after my blog on this topic, the basic findings are the same. The humanitarian data are poor and any attempt to infer to a death toll is extraordinarily difficult. The highest and lowest estimates are not credible. But the death toll is rising fast, and without doubt has surpassed 10,000.
The magnitude scale of assessment classifies 10,000 excess deaths as a “major famine”. Magnitude measurements are widely used in historic and comparative famine studies.
Two Expert Assessments have determined “Famine”
The metric for ‘famine’ used by the Integrated food security Phase Classification (IPC) and the U.S. Famine Early Warning Systems Network (FEWS NET) is not magnitude but severity, including ongoing death rates in worst-hit locations.
Last week, the world’s two leading humanitarian data assessment mechanisms came independently to the same expert conclusion: “famine with reasonable evidence.”
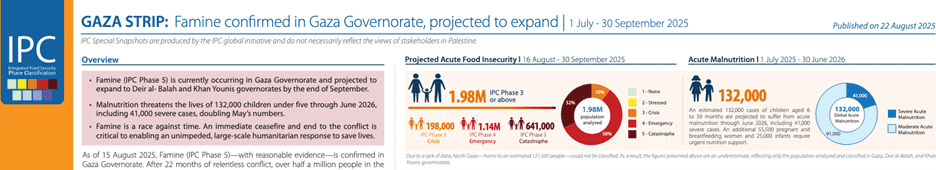
The first report was by the Famine Review Committee of the IPC mechanism, that confirmed that ‘famine (with reasonable evidence)’ existed in Gaza Governorate, an area that includes Gaza City and has an estimated 937,000 people. The FRC followed the protocols laid out in the IPC Technical Manual of 2019 for inferring mortality rates in circumstances of poor data (see pages 86-88 especially). In its August 22 report, the FRC wrote (page 24):
The scarcity of available data is in no way a reflection of actual mortality on the ground. The absence of data should not be interpreted as an absence of mortality. Instead, the collapse of monitoring systems, combined with widespread malnutrition, untreated illness, and destroyed health infrastructure, suggests that true mortality is significantly higher than reported.
The causal pathways for excess mortality in famines are well established: widespread malnutrition, micronutrient deficiencies, lack of access to treatment, health, water, sanitation system collapse, and outbreaks of infectious disease have, historically, resulted in very high levels of excess mortality in famine contexts. The situation in Gaza fits this description. The FRC concludes that the exponential rise in acute malnutrition is being followed by an exponential increase in mortality rates.
Since December 2023, the IPC has been calling on Israel to facilitate better data gathering. Israel has not complied. If Israel wishes to challenge the ‘famine’ determination it can confirm the situation, one way or the other, by enabling more comprehensive and rigorous data gathering.

The second is the U.S. Famine Early Warning System Network (FEWS NET). This is the U.S. government’s own humanitarian data system, which since January this year, is no longer a partner of the IPC, though it continues to follow IPC-compatible methodologies. FEWS NET determined that famine ‘is ongoing in Gaza Governorate and possibly ongoing in North Gaza Governorate as of mid-August.’
Famine with reasonable evidence means there is direct evidence that two of the three thresholds for starvation, acute malnutrition, and mortality have been reached, and analysts reasonably assess from the broader body of evidence that the third threshold has likely been reached. There are three acute malnutrition thresholds for Famine, including mid-upper arm circumference (≥15%, MUAC), weight-for-height z-score (≥30%), and body mass index (≥40%). MUAC has been used to classify Famine in South Sudan and Sudan.
FEWS NET also explains how it came to estimates for mortality in the absence of direct measurement.
While gold standard estimates of mortality in northern Gaza are unavailable, the body of evidence strongly suggests mortality attributed to hunger and disease has likely reached the Famine (IPC Phase 5) threshold of 2 people per 10,000 per day. Empirical evidence from past famines indicates that as starvation and disease push acute malnutrition above the second Famine threshold, levels of mortality rapidly accelerate and surpass the third threshold within 4-12 weeks. Furthermore, once Famine (IPC Phase 5) is underway, mortality typically remains elevated even in the weeks after a scale up of assistance due to lagged physiological recovery from starvation.
The fact that FEWS NET has reached an identical conclusion to the IPC gives reason for confidence in the IPC analysis. Israel has publicly assailed the IPC, but not the U.S. government’s FEWS NET.
Two Key Facts about Famine Mortality
The single most important thing to know is that the number of people who have starvation or malnutrition on their death certificates is a small fraction of the deaths attributable to famine. The measure of famine deaths is excess mortality due to hunger, disease and other factors associated with the crisis.
The second most important thing to know about excess mortality in Gaza related to famine is that it can rise by many multiples before it breaches the IPC ‘famine’ threshold of 2/10,000/day. And because baseline mortality rates for the Palestinian population were much lower than the sub-Saharan populations which have hitherto been the main focus of IPC data alerts, death rates have to rise much more sharply in Gaza to reach that level.
Table 1: Baseline death rates for selected populations
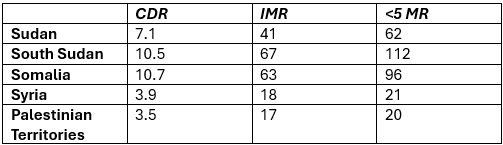
Note: CDR (crude death rate): number of deaths per 1000/year in the total population; IMR (infant mortality rate): number of deaths ages 0-12 months per 1000 live births; <5MR (child mortality rate): number of deaths ages under 5 per 1000 live births.
The following table shows the baseline death rates for the five populations, and the multiple of this required to reach the levels of 1/10,000/day (IPC phase 4, ‘emergency’) and 2/10,000/day (IPC phase 5, ‘famine’).
Table 2: Proportional increase in death rate needed to meet IPC thresholds
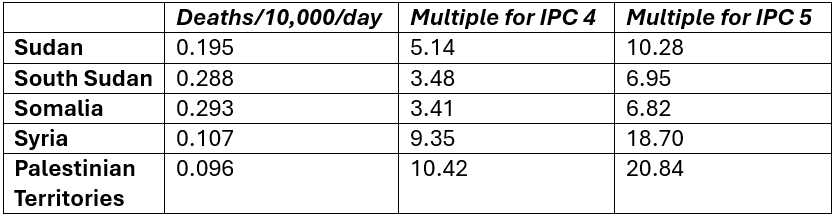
The current IPC technical manual, used for the recent FRC assessment, was drawn up in 2019. At that time there was some discussion as to whether the mortality levels needed for different IPC phases should be absolute levels or should be multiples of the baseline. This approach was followed by some UN agencies and experts. Fabrice Weissman of the epidemiological analysis group CRASH associated with Médecins Sans Frontières, argued that the threshold for ‘emergency’ should be double the normal mortality rate. The IPC technical manual includes the ‘double the baseline’ option of determining IPC phase 4 (emergency) (p. 35), but it doesn’t take the next logical step of setting the threshold for IPC phase 5 (famine) at another multiple, such as 4 or 6 times normal.
Had the IPC taken this step, the threshold for Gaza for ‘famine’ would be either 0.384 or 0.576/10,000/day.
In the World Peace Foundation catalogue of historic famines, which covers the period from 1870, long before the IPC was set up, we use the ‘magnitude’ metric, which is the estimated total number of excess deaths. This includes all deaths from hunger and disease and related causes above the baseline, and would be consistent with using a multiple-of-baseline metric for famine severity. The WPF database includes ‘great famines’ (that killed more than 100,000), because of the difficulties in obtaining reliable historical mortality data for ‘major famines’ (that kill more than 10,000).
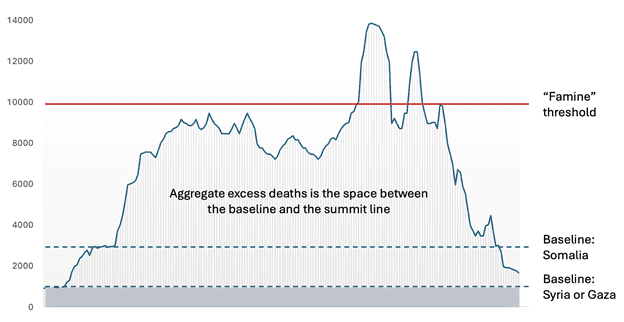
It’s important to emphasize that mortality rates can be many times normal before they reach ‘famine’ thresholds or without reaching those thresholds at all. A ‘great famine’ of 100,000 deaths or more can occur without ‘famine’ by intensity (breaching IPC phase 5 thresholds) having been determined. Additionally, even when an IPC phase 5 famine has been determined, most of the deaths occur in phases 3 and 4. In the case of South Sudan in 2016-17, more than 98% of total deaths occurred in populations in phases 3 and 4, and less than 2% afflicted the locations in phase 5. This can be visualized as a mountain range in which ‘normal’ is the lowlands and IPC phase 5 is an altitude of 10,000 feet. Aggregate famine mortality is the mass of the mountain range as a whole, not just the peaks.
Figure 1: Famine deaths as “mountain range” not just the peak
Direct and Indirect Assessments of Aggregate Mortality
In this blog post, my focus is on the question of aggregate mortality during the timespan of the emergency, rather than on current mortality levels.
In my December 2024 review, I assessed seven different methods for assessing mortality:
- SMART (Standardized Monitoring and Assessment of Relief and Transitions) surveys (none available then or now)
- Census or demographic surveys (none available at that time)
- Physicians’ diagnoses of deaths from malnutrition
- Inference from IPC assessments
- Inference from aggregate food availability
- Scenarios for health crises
- Ratios between trauma and non-trauma deaths (which in turn requires an estimate for trauma deaths)
In this update, let me run over items 2-7 on the list, adding additional relevant data.
Demographic surveys. There are no comprehensive demographic surveys.
Since December, there has been one household survey, using randomized sampling, conducted by Michael Spagat and colleagues, that estimated 8540 excess non-violent deaths between October 2023 and January 2025. (They also estimated trauma deaths, see below under ‘ratio methods’.) If that rate of excess death continued pro rata for the subsequent 7.5 months (up to late August 2025) it would indicate a total excess death toll from hunger and disease of 12675. As with other pro rata projections below, this does not include any increase associated with the recent escalation.
In addition, Médecins Sans Frontières conducted a survey of its own staff and their families in Gaza. This included 2,523 people and the period October 2023-March 2025. We may assume that MSF staff and families have better access to healthcare and income than the population as a whole. They found that the mortality rate had risen by a factor of nearly 5 compared to the pre-October 2023 period, and that non-trauma deaths were rising over time.
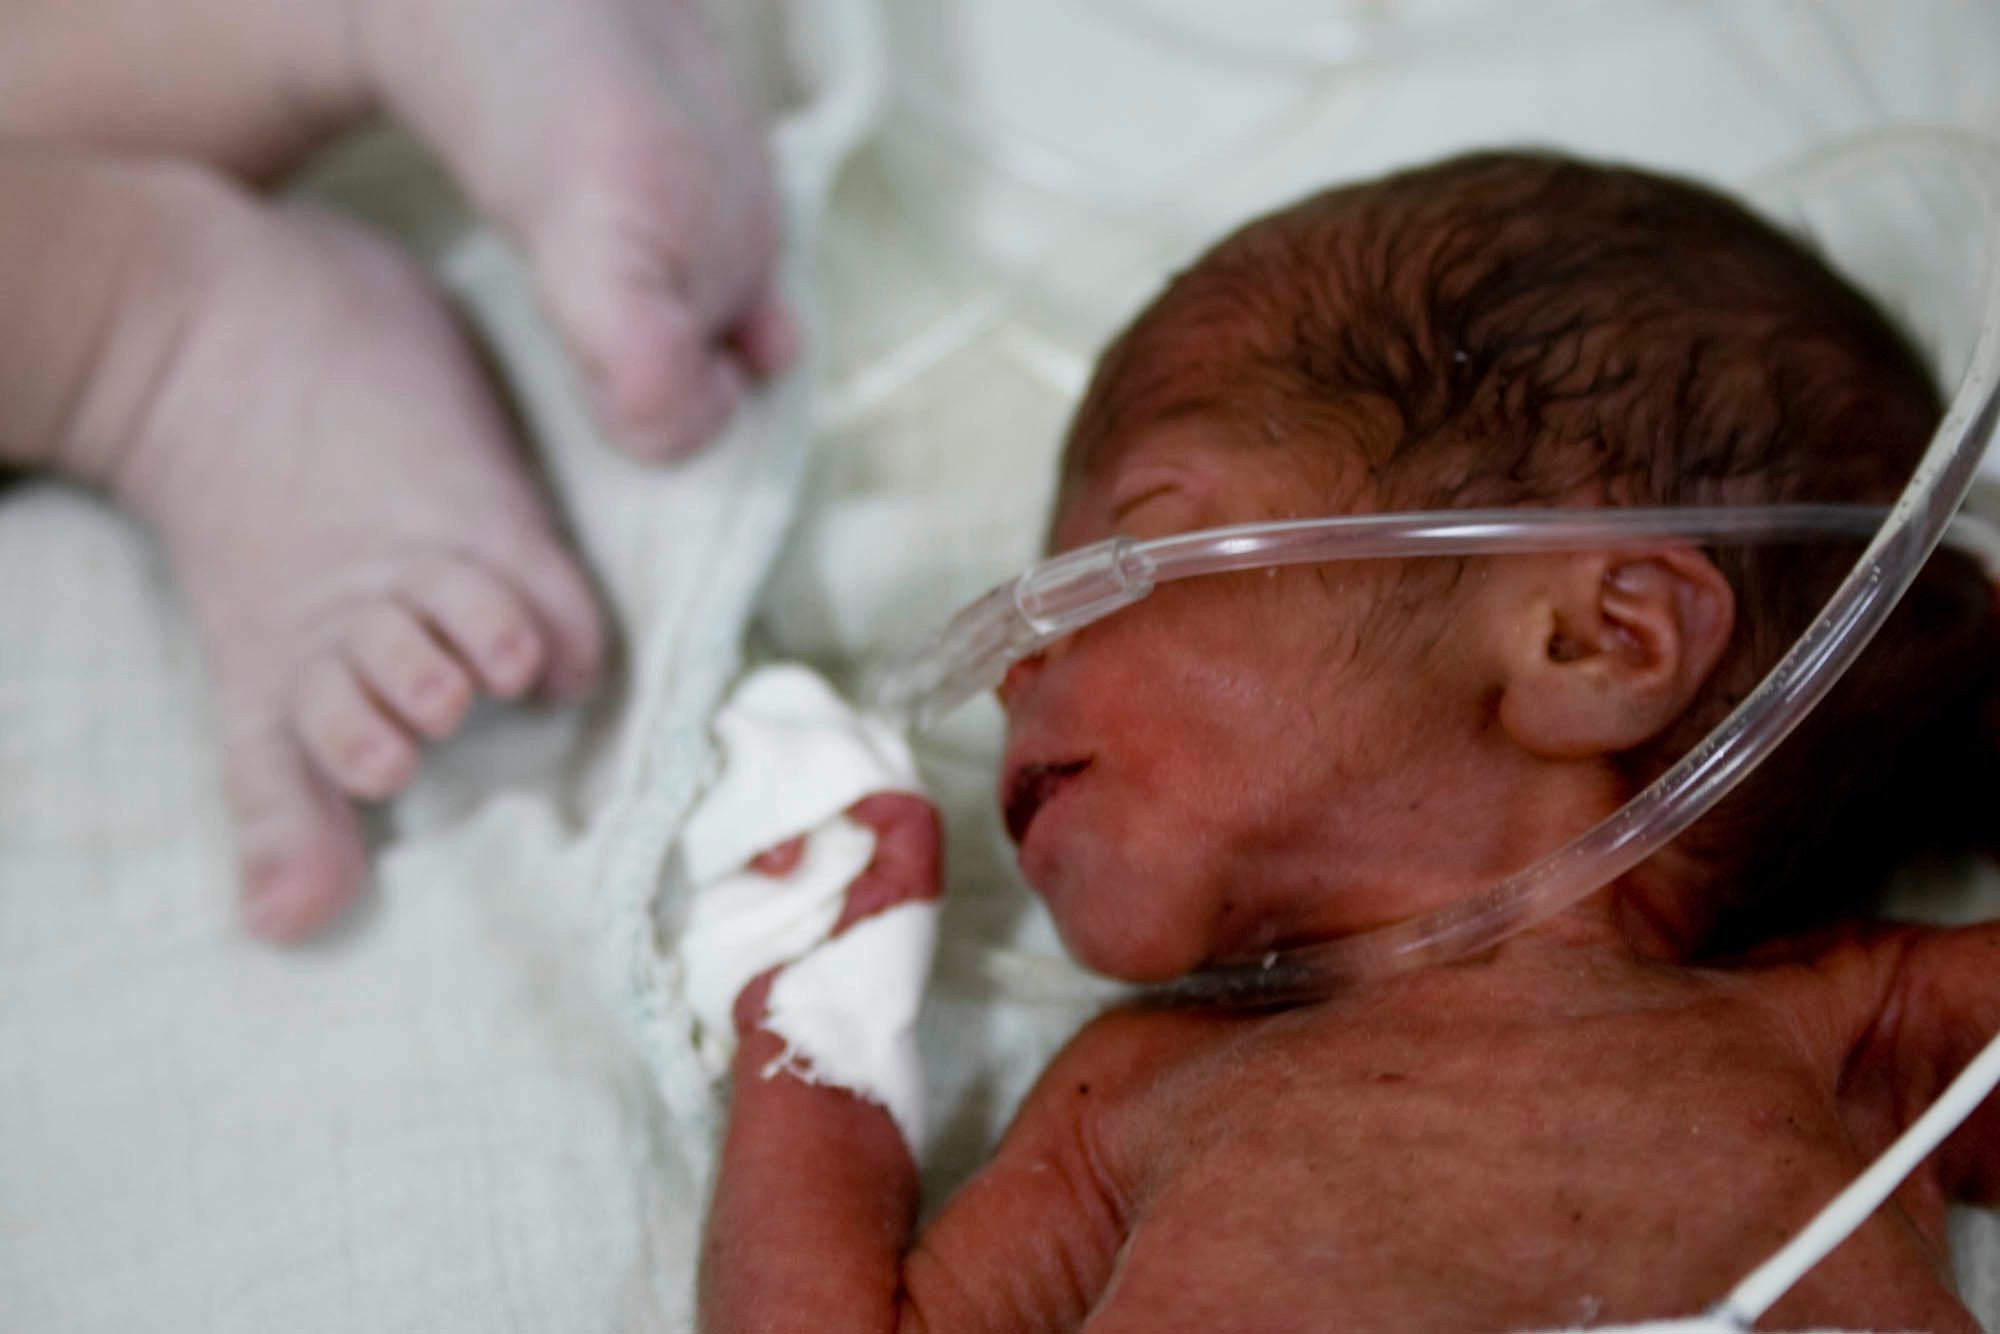
For children under five, mortality increased tenfold over this period. For babies less than one month old, the mortality rate was six times higher. … The MSF survey has found a mortality rate in Gaza of 0.41 deaths per 10,000 people per day. This rises to 0.70 deaths for children under five years old.
Three quarters of the deaths were trauma injuries (mostly blasts) and one quarter non-trauma-related (i.e. hunger and disease).
Physician diagnoses. In December 2024, 32 deaths had been attributed to malnutrition in the period since October 2023. The most recent numbers (as of 20 August 2025), are 269 malnutrition-attributed deaths, including 112 children, of which 204 deaths occurred after 1 July 2025, of whom 51 were children.
Numbers of deaths attributed directly to malnutrition are always a major undercount by an order of magnitude or more. This is due to some patients not making it to a health facility, and because deaths due to infectious diseases not being included. In most famines the biggest killers are infectious diseases, that are more common and more lethal than in a normal population. In Gaza, surgeons in Gaza report numerous cases in which patients cannot recover from injuries because they are malnourished. These should also be included.
Inference from IPC phases. It is tempting to take IPC assessments of the number of people in each food insecurity phase and multiply that by the indicative crude death rate in the IPC table. The IPC specifically warns against doing this as it is unreliable. In December, I cited one source that had done this, to come up with a figure of 62,400, and noted that this was ‘problematic.’ The reason for this is that different populations have different demographic and epidemiological profiles, and as a consequence, the different IPC indicators (acute food insecurity, malnutrition and mortality) do not move in the same way. A population in (for example) rural Somalia or South Sudan will have a much higher baseline crude death rate than an urbanized population in Syria or Gaza. This is due to the different age pyramids of the populations and varying baseline age-specific death rates, with are related to different levels of communicable diseases, vaccination levels, etc.
A recent paper by Danny Orbach and colleagues, ‘Debunking the Genocide Allegations’ uses inference from IPC phases to produce the figures of 123,000 and 78,582 starvation related deaths (pp. 32 and 52) for the period October 2023-January 17, 2025. Orbach et al. ignore the IPC’s disclaimer that this is not an authorized or reliable exercise for estimating excess deaths, but then attribute these numbers to the IPC itself, and use the absence of evidence for this outcome to attack the IPC.
A question that has preoccupied the IPC in several prior cases (e.g. South Sudan) is whether to include the deaths of those seeking food in the aggregate of excess deaths. In the case of South Sudan, many drowned trying to find food in swampy areas. In Gaza, nearly 2,000 people have been killed by the IDF and private GHF contractors trying to get food. Many would argue that these are famine-related deaths.
Aggregate food availability. Every student of famine should know by heart the famous opening lines of Amartya Sen’s 1981 book Poverty and Famines:
“Starvation is the characteristic of some people not having enough food to eat. It is not the characteristic of there being not enough food to eat. While the latter can be a cause of the former, it is but one of many possible causes. Whether and how starvation relates to food supply is a matter for factual investigation.” [emphasis in original.]
In the December blog, I referenced a pre-print by Naomi Fliss-Isakov and colleagues dated June 2024 in which they used the food availability metric to imply that there could not be famine. (They did not make any specific claims about mortality.) They argued that “The quantity and quality of food aid delivered to Gaza have steadily improved since January 2024 and supply sufficient energy, protein, and fat for the population’s needs.”I observed that a peer-reviewed version had not been published, and that the key question was not food availability but food entitlement. The peer-reviewed version was published in December, and the authors scaled back their claims:
“We found that, except in February, food crossing the borders into Gaza exceeded per capita minimal requirements for humanitarian aid. While reliable data do not exist for critical dimensions of food access and consumption across Gaza, these estimates suggest that adequate amounts of nutritious food were being transported into the Gaza Strip during most of the 1st half of 2024.”
Aggregate food availability is also the central element in the Orbach et al. ‘Debunking’ paper. Their account ends prior to the recent descent into famine. There was, according to all metrics, a catastrophic collapse in aggregate food availability when stocks were exhausted in April-May, and inflows from all sources (UN and its partners, Gaza Humanitarian Foundation rations, commercial supplies) have not been sufficient to meet basic nutritional needs since then.
Scenario methods. Scenario-based health impact projections are based on expert evaluations of a range of possibilities. A consortium of institutes produced a set of projections for Gaza in February 2024, including trauma and non-trauma deaths (infectious diseases, endemic; infectious diseases, epidemic; maternal and neo-natal health; and non-communicable diseases), under various scenarios (epidemics and no-epidemics; ceasefire, status quo and escalation). The ‘status quo/without epidemics’ scenario for non-traumatic excess deaths had a median figure of 4,810 for the 6 month projection period. Expanding this pro rata to 18 months, this gives a figure of 14,430. The ‘escalation/with epidemics’ scenario is 17,190 for the 6 month projection period, which expanded pro rata would imply 51,510 excess deaths up to today. (Compare the Spagat et al. household survey estimate, expanded pro rata, of 24,000.)
Ratio methods. There is no war on record in which there are zero non-trauma deaths attributable to the conflict. The rationale of the ratio method is that in wars around the world there is a predictable ratio between the number of deaths from trauma and non-trauma, with the latter including starvation, infectious disease, and untreated non-communicable disease. (Deaths from normally treatable wounds could be put in either category.). Ratios shift as wars progress. Typically, trauma deaths peak in both absolute numbers and as a proportion of total mortality near the beginning of a conflict (or episode thereof), and non-trauma deaths increase in numbers and proportion of the total over time.
In December, I cited studies with ratios of non-trauma to trauma deaths ranging from 1:2 to 4:1. (The wide range of ratios suggests that the method has to be used with care.) Urban warfare in middle-income countries (e.g. Iraq) tends to the lower ratios, while irregular wars in rural contexts (e.g. Democratic Republic of Congo) to the higher. It is likely that the Gaza war is towards the lower end. (The figure in the MSF staff members and families survey is 1:3.)
The ratio method requires a figure for trauma deaths. The Gaza Ministry of Health has recorded 62,122 trauma deaths as of August 20, 2025. This number is an underestimate. Since early 2024 the MoH has guessed that there are 10,000 bodies under the rubble. A study by Zeina Jamaluddine and colleagues using official hospital lists, an MoH survey, and social media obituaries to calculate traumatic fatalities estimated that the MoH figure was an underestimate by 41%. The household survey by Michael Spagat and colleagues found that it was an underestimate by 39%. These studies imply that the accurate figure for violent deaths today is around 100,000.
Taking the lowest ratio (1:2), this would imply 50,000 excess non-trauma deaths. (Compare the ‘escalation/with epidemics’ scenario projection of 51,510 and the household survey pro rata projection of 12,675.) This is without taking into account the recent escalation in the crisis.
Overall Assessment
In December I concluded that “figures of 10,000 or more deaths caused by starvation and health crisis/social disruption can be considered credible.” Today, I fear that we have every reason to believe that death rates from hunger and disease are several multiples of that number. They are escalating fast. Gaza already qualifies as a “major famine.”
A figure of 100,000 excess deaths associated with food insecurity would qualify as a ‘great famine’. If the situation in Gaza continues to deteriorate, reaching that threshold is a possibility.
As before, the onus is on Israel to permit rigorous, independent assessments of the humanitarian catastrophe in Gaza. Until this is possible, we should operate on the assumption that the worst case is unfolding.
Blog updated on 9/2/2025 with corrected figures from the Spagat et al. survey